Quick answer
The median full-time employee in Canada earned about $68,640 a year in 2025 ($1,320 a week). By province it ranged from $72,781 in Alberta, $71,947 in British Columbia and $70,179 in Ontario down to $58,929 in Prince Edward Island. The average full-time wage, $78,532, is higher because a minority of high earners pulls it up.
Higher pay does not always mean more money left over. After a one-bedroom rent, a median full-time worker keeps about $3,400 a month in Edmonton but about $2,400 in Toronto and Vancouver and $1,950 in Halifax. Groceries cost 5–7% more in Atlantic Canada, Alberta and BC than in Ontario.
Salary by province, 2025
Full-time employees, all industries, from Statistics Canada's Labour Force Survey (2025 annual averages, released January 2026). Annual figures are weekly wages × 52. Minimum wage is the general rate in force in November 2026.
| Province | Median salary | Average salary | Median hourly | Minimum wage | Median vs 2024 |
|---|---|---|---|---|---|
| Alberta | $72,781 | $83,177 | $34.97 | $15.00 | +4.0% |
| British Columbia | $71,947 | $81,781 | $35.00 | $18.25 | +2.8% |
| Ontario | $70,179 | $81,652 | $34.62 | $17.95 | +2.8% |
| Saskatchewan | $65,250 | $73,319 | $31.25 | $15.70 | +1.2% |
| Quebec | $65,229 | $73,623 | $33.00 | $16.60 | +4.3% |
| Newfoundland and Labrador | $64,896 | $75,191 | $30.07 | $16.35 | +4.0% |
| Nova Scotia | $61,991 | $69,760 | $29.80 | $17.00 | +6.0% |
| New Brunswick | $59,729 | $67,186 | $28.85 | $15.90 | +4.4% |
| Manitoba | $58,968 | $67,601 | $28.74 | $16.40 | +1.7% |
| Prince Edward Island | $58,929 | $64,302 | $28.21 | $17.30 | +3.7% |
| Canada | $68,640 | $78,532 | $33.65 | — | +4.8% |
Median: half of full-time employees earn more, half less. Ontario, PEI, Nova Scotia, Manitoba and Saskatchewan raised their minimum wage on October 1, 2026; PEI rises again to $17.60 on April 1, 2027. Alberta's $15.00 has not changed since 2018. Territories (not in the table): Yukon $18.51 (April 1, 2026), Northwest Territories $17.20 and Nunavut $20.17 (both September 1, 2026). Minimum wages last checked November 4, 2026.
Entry-level, mid-career and high earners
A single average hides very different situations. Young workers are paid almost the same everywhere; the gap between provinces opens up in mid-career and is widest at the top.
| Province | Minimum wage | Median hourly, age 15–24 | Median hourly, age 25–54 | People earning $100k+ | In Canada's top 10% |
|---|---|---|---|---|---|
| Alberta | $15.00 | $22.00 | $36.92 | 18.4% | 13.0% |
| British Columbia | $18.25 | $24.00 | $37.02 | 15.9% | 11.0% |
| Ontario | $17.95 | $22.00 | $36.92 | 16.0% | 10.7% |
| Saskatchewan | $15.70 | $21.00 | $34.00 | 14.4% | 9.7% |
| Quebec | $16.60 | $23.05 | $35.00 | 12.2% | 8.0% |
| Newfoundland and Labrador | $16.35 | $20.60 | $33.00 | 12.0% | 8.3% |
| Nova Scotia | $17.00 | $20.00 | $31.67 | 10.9% | 6.8% |
| New Brunswick | $15.90 | $21.00 | $31.00 | 9.2% | 5.7% |
| Manitoba | $16.40 | $20.00 | $30.00 | 11.0% | 6.9% |
| Prince Edward Island | $17.30 | $20.00 | $30.00 | 8.9% | 5.4% |
| Canada | — | $22.00 | $35.90 | 14.8% | 10.0% |
Hourly wages: full-time employees, 2025 (Labour Force Survey). $100k+ and top 10%: share of all people with income in 2023, the latest tax-filer data (Statistics Canada tables 11-10-0008-01 and 11-10-0055-01). Canada's top 10% started at $116,500 of total income.
- Starting out: the median full-time worker aged 15–24 earns $20–24 an hour in every province. Moving province for a first job changes pay by a few dollars an hour at most, while rent can differ by $1,000 a month.
- Mid-career: at ages 25–54 the median is about $37 an hour in Alberta, BC and Ontario against $30–32 in Manitoba and the Maritimes, a gap of roughly $11,000–$14,000 a year for full-time work.
- High earners: almost one in five people with income in Alberta had $100,000 or more in 2023, against fewer than one in ten in PEI and New Brunswick. High-paying jobs are concentrated in Calgary, Toronto, Vancouver and Ottawa.
Salary vs rent and groceries: what is left
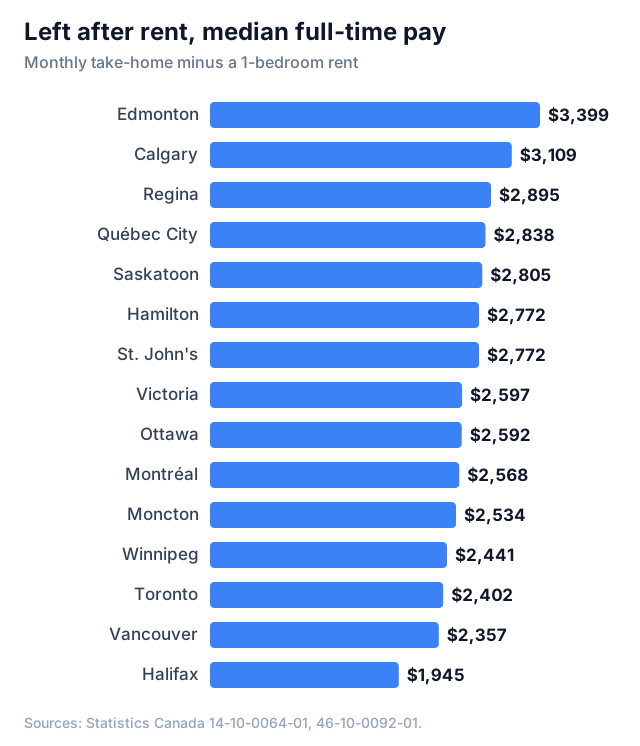
Take-home pay is 2026 income tax, CPP/QPP and EI for a single employee on the province's median full-time salary (from our take-home pay calculator). Rent is the average one-bedroom asking rent in Q2 2026 (rent by city). The last two columns are for a full-time minimum-wage worker (40 hours a week).
| City | 1-bedroom rent | Median worker: left after rent | Rent share of take-home | Minimum wage: left after rent | Rent share |
|---|---|---|---|---|---|
| Edmonton | $1,260 | $3,399 | 27% | $989 | 56% |
| Calgary | $1,550 | $3,109 | 33% | $699 | 69% |
| Regina | $1,250 | $2,895 | 30% | $1,050 | 54% |
| Québec City | $1,210 | $2,838 | 30% | $1,163 | 51% |
| Saskatoon | $1,340 | $2,805 | 32% | $960 | 58% |
| Hamilton | $1,720 | $2,772 | 38% | $856 | 67% |
| St. John's | $1,270 | $2,772 | 31% | $1,059 | 55% |
| Victoria | $2,040 | $2,597 | 44% | $594 | 77% |
| Ottawa | $1,900 | $2,592 | 42% | $676 | 74% |
| Montréal | $1,480 | $2,568 | 37% | $893 | 62% |
| Moncton | $1,290 | $2,534 | 34% | $991 | 57% |
| Winnipeg | $1,320 | $2,441 | 35% | $1,020 | 56% |
| Toronto | $2,090 | $2,402 | 47% | $486 | 81% |
| Vancouver | $2,280 | $2,357 | 49% | $354 | 87% |
| Halifax | $1,880 | $1,945 | 49% | $512 | 79% |
Uses each province's median salary for all its cities; pay in the largest cities is usually somewhat higher than the provincial median. Minimum-wage take-home leaves out refundable credits such as the Canada Workers Benefit and the GST/HST credit, which can add several hundred dollars a year at this income. Charlottetown is not covered by Statistics Canada's asking-rent series.
Groceries narrow the gap a little but rarely reverse it. The same 24-item basket cost $145.93 in Ontario and $149.24 in Quebec, $156–158 in the Maritimes and Alberta, and about $160 in BC and Newfoundland and Labrador in August 2026 (grocery prices by province). For a household spending $800 a month on food, a 7% difference is about $55 a month, far less than the rent differences above.
Cheaper rent is not the same as cheaper living
Prince Edward Island is a good example. Its median full-time salary ($58,929) is about 16% below Ontario's, and the same grocery basket costs 7% more ($156.71 against $145.93). Only 8.9% of Islanders with income had $100,000 or more in 2023, the lowest share of any province. Lower housing costs have to make up for both lower pay and higher prices at the checkout.
Halifax shows what happens when they do not. Rents there ($1,880 for a one-bedroom) are now close to Ottawa's, but salaries are set by Nova Scotia's lower wage level, so a median full-time worker has less left after rent in Halifax than in Toronto or Vancouver. Before moving east for a lower cost of living, compare the job offer, not only the rent.
The opposite holds in Alberta: salaries are the highest of the provinces and Edmonton and Calgary rents are well below Toronto and Vancouver, so a median worker keeps the most. The exception is minimum-wage work: Alberta's $15.00 is the lowest in Canada, and a full-time minimum-wage worker in Calgary has about $700 left after rent.
Why the average misleads: who lives in each city
Average income is pulled up by a small number of very high earners, and the median is pulled down where many people are students, newcomers early in their careers, part-time workers or retirees. Comparing the two, and the share of people at the top and bottom, shows how different cities are. For city-by-city breakdowns of income, immigrants and crime, see Ontario cities compared, B.C. cities compared, Alberta cities compared and Quebec cities compared.
| Metro area | Median income | Average income | Below Canada's median | In Canada's top 1% | Median age |
|---|---|---|---|---|---|
| Ottawa-Gatineau | $55,100 | $68,700 | 41.3% | 1.03% | 47 |
| Victoria | $52,700 | $67,500 | 41.8% | 1.12% | 50 |
| Québec City | $51,100 | $61,100 | 42.5% | 0.72% | 49 |
| Regina | $48,800 | $61,500 | 45.5% | 0.78% | 44 |
| Edmonton | $47,800 | $63,700 | 46.8% | 0.99% | 44 |
| Calgary | $47,700 | $73,500 | 46.9% | 2.08% | 43 |
| Saskatoon | $47,600 | $61,700 | 46.7% | 0.86% | 43 |
| Hamilton | $46,500 | $63,100 | 47.8% | 1.20% | 48 |
| Halifax | $46,500 | $58,700 | 47.7% | 0.79% | 45 |
| St. John's | $46,100 | $61,000 | 47.9% | 1.04% | 48 |
| Montréal | $45,000 | $59,900 | 49.2% | 1.05% | 47 |
| Vancouver | $43,800 | $63,300 | 50.2% | 1.41% | 45 |
| Kitchener-Waterloo | $43,700 | $58,600 | 50.3% | 0.98% | 42 |
| Winnipeg | $43,000 | $55,400 | 51.2% | 0.76% | 45 |
| London | $42,700 | $55,600 | 51.4% | 0.76% | 45 |
| Toronto | $40,100 | $63,000 | 53.3% | 1.59% | 44 |
| Canada | $44,100 | $59,900 | 50.0% | 1.00% | 47 |
Total income of all tax filers (employment, business, pensions, investments and government benefits), 2023, Statistics Canada table 11-10-0055-01. "Below Canada's median" is the share of the city's tax filers with less than $44,100. Median age is of tax filers.
- Toronto is two cities in one. It has the lowest median of any large metro area ($40,100) and the most people below the national median (53.3%), yet more of its residents are in Canada's top 1% than anywhere except Calgary. A large share of Canada's newcomers and international students start out in Toronto, many in entry-level or part-time jobs, alongside the country's finance and head-office jobs.
- Calgary has the most high earners. 2.08% of its tax filers were in the national top 1% and 19.7% of people with income had $100,000 or more, which is why its average ($73,500) is far above its median.
- Capitals have the fewest low earners. Ottawa-Gatineau, Victoria and Québec City have the highest medians and only about 41–43% of people below the national median: stable public-sector jobs and pensions lift the middle rather than the top.
- Older regions show lower incomes. Tax filers in the Atlantic provinces have a median age of 49–53, against 44 in Alberta. Retirement income is usually lower than a salary, so part of the gap in total income is age, not pay.
Is $50k, $75k, $100k or $150k a good salary in Canada?
Where a salary ranks among all Canadians with income in 2023 (Statistics Canada table 11-10-0008-01), and how it compares with the typical full-time salary.
| Income | Share of Canadians earning this or more | How it compares |
|---|---|---|
| $50,000 | 45.2% | Above the median for everyone with income ($44,100), below the median full-time salary ($68,640). Workable in Québec City, Regina or Moncton; tight for one person in Toronto or Vancouver. |
| $75,000 | 26.1% | Above the median full-time salary in every province. A one-bedroom still takes 44% of take-home pay in Toronto and 47% in Vancouver. |
| $100,000 | 14.8% | About the top 15%. From 8.9% of people in PEI to 18.4% in Alberta earn this much. |
| $150,000 | 5.4% | About the top 5% (the top 5% started at $152,700). |
| $300,000 | under 1% | Top 1% (it started at $293,800). |
"Good" depends on where you live and who you support. For what a salary leaves after tax in each province, see take-home pay by province; for couples and families with children, see family budgets in six cities; for a full monthly budget by city, use the cost of living calculator.